
LRS researches how technology affects work and how to use it to our advantage.
The LRS agreements database (AGREED) represents one of the most substantial collections of Southern and Pan-African labour agreements assembled in a single archive, spanning 26 years (2000–2026), nine African countries, and every major sector of the formal economy.
In March 2026, we embarked on an ambitious project to take stock of the agreements on agreed database. With over 1600 agreements, and our team working hard on other projects, we enlisted the help of Claude AI. The LRS is not only researching the impact of technology on work but also figuring out ways we can use technology to our advantage.
Claude analysed 1433 agreements.
Sectors covered
Manufacturing – 395 documents
Healthcare and Social services – 201 documents
Transport and logistics – 122 documents
Mining – 108 documents
Personal services – 95 documents
Food and Beverage – 84 documents
Retail and wholesale – 79 documents
Topics
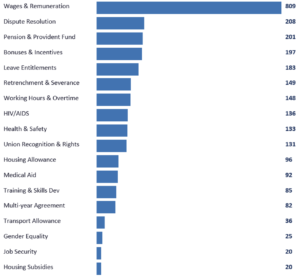
The database covers a large number of topics. In the graph below, the number on the right refers to how many agreements the topic appears in.
Overall wage distribution
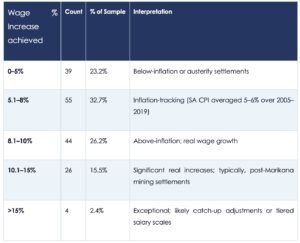
Claude did a wage analysis, which was limited by several factors: Where annual percentage wage increases are explicitly stated and extractable from the first 4–8 pages, the following patterns emerge. Note that the sample (n=168) represents approximately 11.7% of the corpus; true prevalence of wage data is much higher but often appears in tabular wage schedules that resist automated extraction.
What we learned is that while AI can do a lot – clear from this analysis – there are limitations like what is readable. Some older agreements are difficult to read, where a human eye could distinguish, this technology is still limited.
The overall mean is 7.7% and the median falls in the 6–8% range, consistent with South Africa’s persistent above-target inflation environment. The 6–10% band accounts for 58.9% of all wage settlements in our sample, suggesting this is the ‘normal’ range for formal sector collective agreements.

Geography
South Africa dominates the database across all dimensions. All 18 sectors are represented. The SA sub-collection spans the full 2000–2026 period and includes agreements from national bargaining councils (MIBCO, NBCCMI, MEIBC, HCSBC), bilateral company-level agreements (ArcelorMittal, Samancor, Transnet, Sasol), public service co-ordinating bargaining council (PSCBC) agreements, and sectoral determinations published by the Department of Labour.
There are 41 documents in the pan-African sub-collection. It comprises agreements negotiated by three South African retail companies as they expanded across the continent.
Statistical outliers
- 88 multi-union agreements (3+ unions) — 6.1% of the corpus. These concentrate in Mining (NUM/SOLIDARITY/UASA/NUMSA), heavy Manufacturing (ArcelorMittal, Samancor, Sasol), and Public Service (PSCBC).
- 14 agreements reference wage increases above 12%. All are NBCCMI/CCMA/SACTWU clothing manufacturing agreements from 2011, where the 3–15% range likely represents a tiered wage schedule (minimum to maximum increases by grade) rather than a single uniform increase.
If you’d like to see the full report created by Claude, see here.
The most significant finding for the LRS is the ability analyse big amounts of data with the support of AI. We still had to refine and set parameters, but the possibilities of AI to assist us to look closely at our data creates a wealth of new possibilities.
RELATED ARTICLES
Let’s talk AI
AI: All the tech we cannot see
Online Course: Understanding AI and its impacts in the workplace